Compliance Management
 Risk Management
 Third Party Risk Management
 Data Privacy Management
 Internal Auditing
 Business Continuity Management
 Continuous Control Monitoring (CCM)
 Trust Center
 AI Governance
- Data Privacy
- 30th Aug 2026
- 1 min read
Why US Data Breaches Cost $11.5M in 2026

- Written by
In Short..
- US breach costs run far ahead of the global average: IBM's 2026 report puts the US average at $11.5M against $4.99M globally, a gap it attributes to regulatory fines and business costs rather than more severe incidents.
- Detection speed and lost business now drive most of the cost: these two categories made up 63% of total breach costs this year, more than the technical work of containment.
- DORA already treats resilience as an ongoing obligation: in force since 17 January 2025, it expects in-scope EU financial entities to demonstrate operational resilience continuously.
- NIS2 reaches UK organisations only indirectly: through EU customers, data flows or supply-chain relationships with in-scope EU entities, while the UK runs its own parallel track.
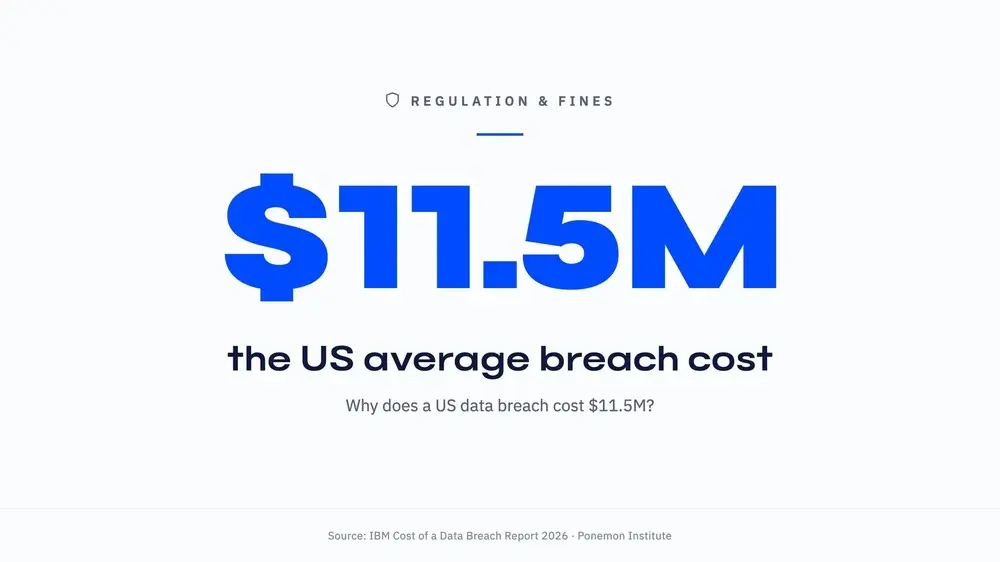
The average cost of a data breach in the United States reached $11.5M in 2026, more than double the global average of $4.99M, according to the IBM Cost of a Data Breach Report 2026, independently confirmed by HIPAA Journal. IBM attributes that gap to regulatory fines and business costs rather than more severe attacks.
For compliance, risk and finance leaders in the UK and EU, the mechanism behind that premium is increasingly present in European regulatory frameworks too, and regulatory exposure is becoming a material, and growing, part of the financial impact of a breach.
Expert View

Matt Davies Chief Product Officer, SureCloud |
What our experts say about closing the regulatory evidence gap
"The pattern I see most often is that the technical incident is the easy part. A breach that takes six weeks to contain can take six months to fully account for to a regulator, because nobody kept the evidence trail while the system was running normally." |
Why US Breach Costs Run So Much Higher
The $11.5M US average and $4.99M global average sit in the same report, but they reflect different regulatory and business environments more than different categories of attack.
Two cost categories drove this year's increase everywhere: detection and escalation, and lost business, the disruption and customer churn that follows a breach becoming public. Together, these two categories made up the majority of total breach costs (63%) in this year's report.
Detection and escalation measures how fast an organisation can find and confirm what happened. It's the clock that starts before anyone outside the organisation knows anything happened. Lost business measures how much trust and revenue it sheds while doing so, and how quickly a regulator, customer or auditor hears about it.
In the US, a breach triggers obligations across multiple federal and state frameworks at once. Notification timelines are short, regulatory investigations move quickly, and class-action exposure follows close behind. Each of these compounds the cost of slow detection and public disclosure independently, and together they create the multiplier IBM's figures reflect.
For UK and EU leaders, the direction their regulatory environment is moving in matters more than how closely it's come to resemble the US today.
Why UK and EU Leaders Should Take the US Numbers Seriously
A different legal system, a different litigation culture and a different regulatory structure make it easy to treat US breach-cost data as someone else's problem. But European frameworks are absorbing the same cost drivers now, through DORA and NIS2, and that trend won't reverse.
IBM's 2026 data already shows the same trend taking hold in Europe: average breach costs rose 18% to $4.93 million in Germany and 16% to $7.37 million in Benelux, both DORA and NIS2 jurisdictions.
Once regulators, customers and markets expect evidence of resilience, the cost of a breach extends beyond containment and remediation. The US figures show how regulatory and business costs compound after an incident: what starts as a technical failure becomes a compliance failure, then a reputational event, then a customer-retention problem. The organisations that manage the total impact most effectively demonstrate, quickly and credibly, that their controls operated as intended.
For regulated organisations operating across Europe, these exposures are already live:
- Regulatory investigation costs: Responding to supervisory inquiries requires documented evidence of control operation, evidence that carries its own cost to reconstruct after the fact if it doesn't already exist.
- Customer and counterparty scrutiny: Enterprise customers increasingly require evidence of compliance posture as a condition of contract. A breach that triggers that scrutiny without supporting documentation creates commercial risk beyond the regulatory fine.
- Supply chain obligations: Organisations that sit within regulated supply chains, whether as a supplier to a financial entity or as an operator of critical infrastructure, face upstream requirements that mirror the obligations placed on their customers.
- Parallel UK regulatory expectations: UK GDPR, the FCA's operational resilience framework and the NCSC's Cyber Assessment Framework each carry their own evidence and reporting obligations. The FCA issued £15.7M in fines in Q1 2026 alone, a sign of how active enforcement has become.
None of this requires predicting an $11.5M breach bill. The cost of a breach increasingly reflects what an organisation can demonstrate to a regulator, customer or auditor, alongside what it can fix.
DORA Is Already Live, NIS2 Enforcement Is Taking Shape Across Europe
DORA: Resilience as an Ongoing Obligation
The Digital Operational Resilience Act applies to in-scope EU financial entities, including banks, investment firms, insurance undertakings, crypto-asset service providers and their critical ICT third-party providers. DORA has been enforceable since 17 January 2025. It requires firms to demonstrate ICT risk management, incident reporting, resilience testing and third-party oversight on an ongoing basis.
The emphasis on continuous demonstration matters. Supervisors can request evidence of control operation at any point, and producing that evidence quickly, accurately and in the format regulators expect is itself a compliance obligation.
Where NIS2 Reaches UK Organisations
NIS2 set a transposition deadline of 17 October 2024 for EU member states. Implementation and enforcement vary by member state: some have transposed the Directive fully; others are at different stages. Organisations should take legal advice on their specific obligations based on jurisdiction and operational scope.
NIS2 is EU legislation. UK organisations enter scope only indirectly, through EU operations, EU-regulated customers or supply chain relationships with in-scope EU entities. UK regulatory expectations around operational resilience and cyber risk management are developing in parallel, and the direction of travel matches the EU approach.
The practical implication for organisations operating across both jurisdictions: the evidence requirements under DORA and NIS2 are substantively similar, documented controls, demonstrable resilience, auditable incident response. Building that capability once, in a way that satisfies both, costs less than treating them as separate programmes.
Why Continuous Evidence Beats a Once-a-Year Snapshot
Most organisations still approach compliance as a periodic exercise: controls are assessed, evidence is gathered, and a report is produced. The gap between assessments is where risk accumulates. Quietly, at first.
That's fine when regulators and auditors ask questions on a schedule. It becomes a liability when they ask questions after an incident, because the evidence required to demonstrate that controls operated as intended then has to be reconstructed under pressure, days or weeks after the fact.
For SureCloud, readiness means being able to demonstrate that controls operated as intended before an incident or regulatory review, with the evidence already on hand. That's continuous assurance in practice.
What Continuous Compliance Monitoring Closes
Continuous Compliance Monitoring replaces point-in-time assessment with an ongoing, automated view of control status. Evidence is captured continuously, as controls operate.
Regulatory response time drops as a result: when a supervisor requests evidence of control operation, the documentation already exists and is retrievable, without a scramble to rebuild it under pressure. And the evidence gap closes before it's ever exposed: incidents and regulatory reviews reveal gaps in control evidence, and closing those gaps in advance costs less than discovering them mid-investigation.
Inside SureCloud's platform, this runs through Gracie AI Agents with Personas and Skills, built around continuous assurance as the default. A Compliance Manager Persona collects evidence and tests controls continuously in the background, and flags exceptions the moment they occur.
That Persona operates only within the permissions a human Compliance Manager would hold, and draws on a Skills library built from SureCloud's own two decades of GRC delivery. Evidence accumulates automatically as a result, so a review or a regulator's request finds a record already in place.
SureCloud's Compliance Management platform maps controls once across ISO 27001, SOC 2, DORA, NIS2 and other frameworks, so the same evidence trail supports every regulator that asks for it.
Putting the $11.5M Figure in Context
The $11.5M figure isn't static.
It grew from $10.22M the year before, according to IBM's own year-over-year figures, as reported by HIPAA Journal, and the global average, up 12% year on year to $4.99M, is following the same upward trajectory at a smaller scale.
The priority is reducing the evidence gap before an incident or regulatory review exposes it. Organisations that can demonstrate continuous control operation are better placed to manage the post-breach costs that IBM's report identifies as the larger share of total breach impact.
Found this useful?
Choose SureCloud as a preferred source in Google and you will see more of our GRC guidance in Top Stories, AI Overviews and AI Mode. It takes one click and you can undo it at any time.
Let Gracie get the work done.
Gracie drafts summaries, evidence requests and audit narratives across your programme — you stay in control.
See Gracie in action or book a full platform demo →See what SureCloud costs
A short form, no sales call. Pricing built around your GRC estate.
Get PricingIDC names SureCloud the industry's first cross-domain agentic GRC platform
Read the independent analyst view on how SureCloud is redefining risk and compliance.
Download for free